ITOps Agent Platform is an open source web platform that promises to orchestrate multiple AI agents to automate IT operations. After actually running it locally, connecting a model through an OpenAI-compatible proxy, and testing a Prometheus alert scenario, my verdict is clear: it’s worth trying in a lab, but not ready to drop straight onto a sensitive production environment.
ITOps Agent Platform: what is it?
ITOps Agent Platform targets a very concrete problem: turning alerts, scripts, servers, and workflows into an AI-assisted operations console.
The project presents itself as a Chinese multi-agent platform for IT Ops. The interface includes predefined agents for alert analysis, diagnostics, logs, compliance, change management, reporting, server commands, and network inspection. Everything runs on a Node.js backend, a SQLite database, a React frontend, and visual workflows.
As a freelance security and DevOps engineer, the pitch that caught my attention was this: receive a Prometheus or Zabbix alert, ask an agent to analyze the context, then produce an action plan that separates what can be automated from what needs human approval.
| Element | What I observed |
|---|---|
| Product | Multi-agent ITOps web console |
| Stack | Node.js, Express, SQLite, React, Vite, Socket.io |
| Documented deployment | Docker Compose or source install |
| Test performed | OpenAI-compatible model, alert agent, Prometheus scenario |
| Result | Structured analysis recorded in execution history |
Installing ITOps Agent Platform
I cloned the GitHub repo into /tmp, read the README, and inspected the scripts. The Docker path is well documented, but Docker wasn’t available in my test environment, so I went with the source install instead. That’s actually a decent robustness test for a full web project.
First surprise: installing directly in /tmp failed because the esbuild binary couldn’t execute from that mount. So I kept the reference clone in /tmp and ran the source install in a temporary directory under the test root, which I deleted afterwards.
The relevant commands looked like this:
npm run install:all
npm run build
NODE_ENV=development PORT=3001 node backend/dist/app.js
cd frontend
npm run preview -- --host 127.0.0.1 --port 8080
The build genuinely compiled the TypeScript backend and the Vite frontend. On the dependency side, npm reported vulnerabilities: 13 in the backend (2 critical) and 13 in the frontend (1 critical). That’s not necessarily exploitable as-is, but for an ops console that handles server access, it’s something to fix before any serious use.
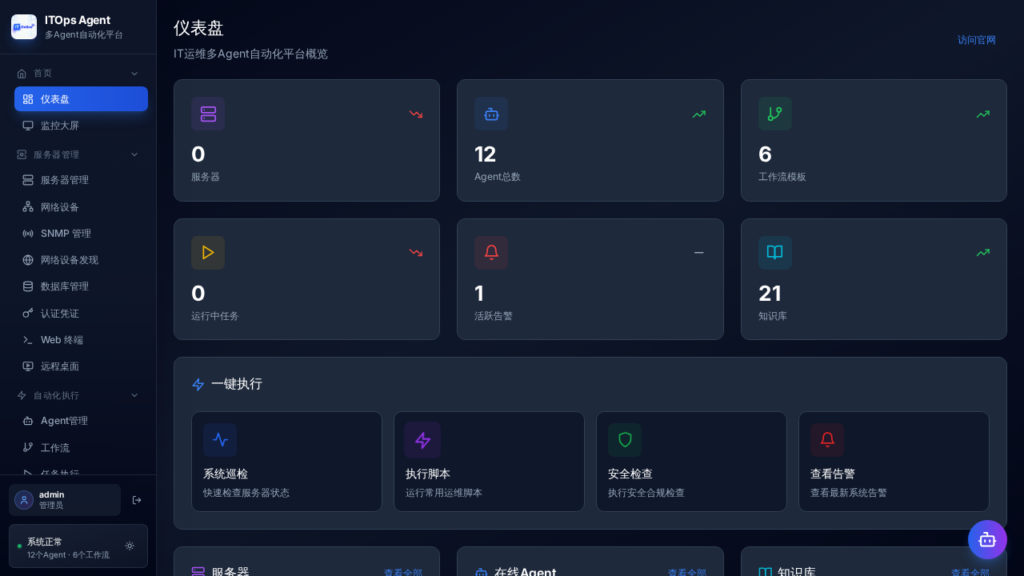
ITOps Agent Platform in practice
On first startup, the backend initialized SQLite, created the admin user, loaded the agents, and exposed /health. The health response was usable: overall status healthy, database with 61 tables, memory, CPU, database size, WebSocket state, scheduler state, and task queue.
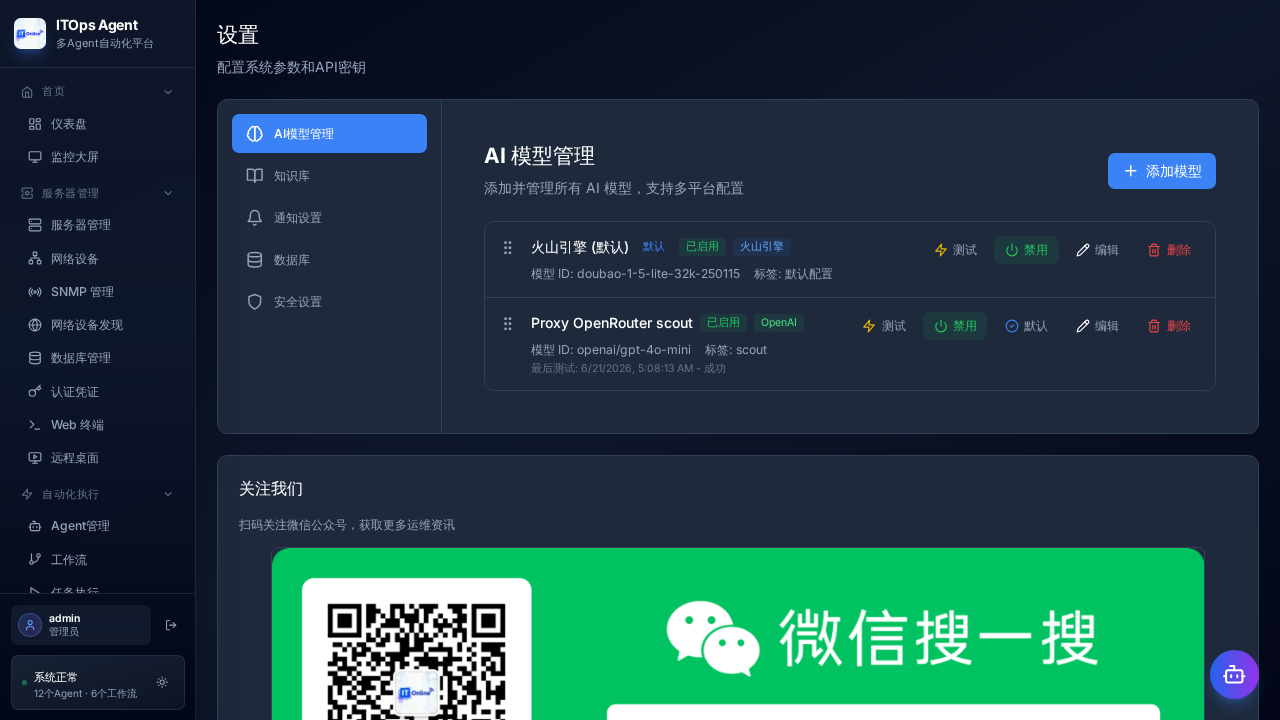
I then changed the initial password, created a model named Proxy OpenRouter scout configured against a local OpenAI-compatible base, and ran a connectivity test. The product called the proxy and returned: model connected, latency around 1.3 seconds.
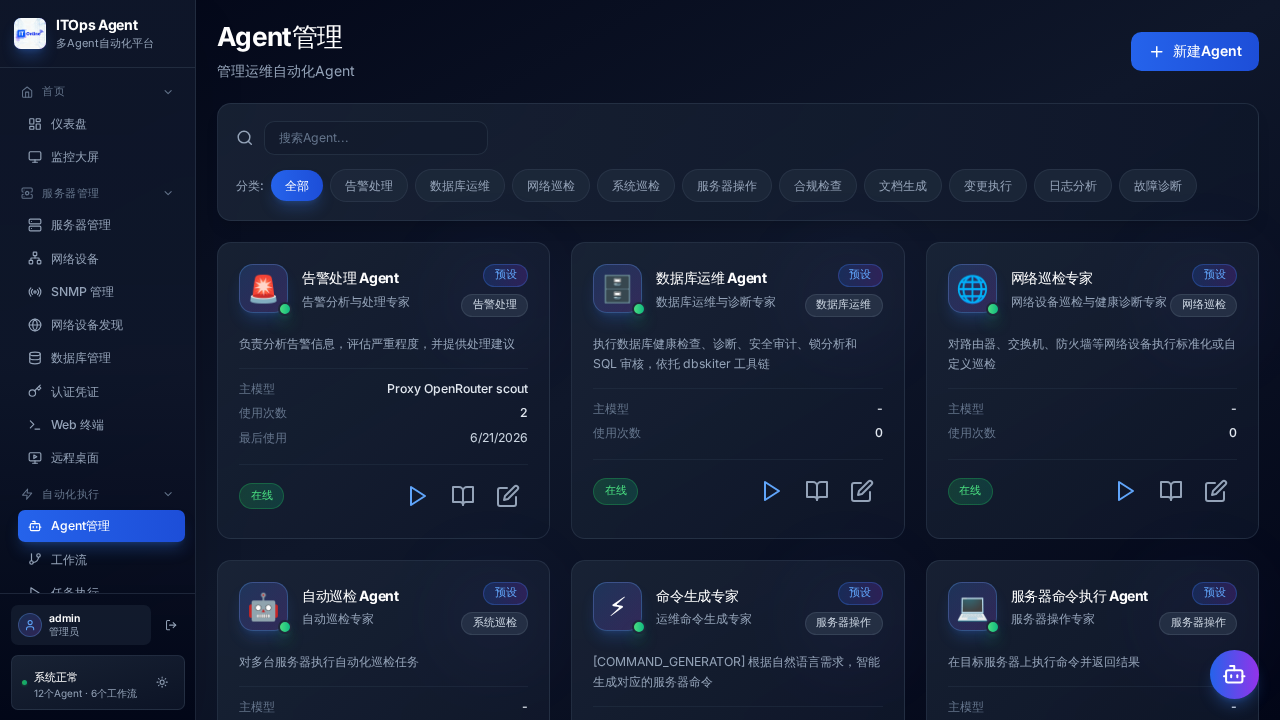
The real test was the alert agent. I sent it a deliberately realistic alert: server api-prod-01, CPU at 94%, load average at 8.7, Nginx 5xx error rate at 12%. I asked it to separate automatic actions from actions requiring approval.
The result wasn’t just an LLM ping. ITOps Agent Platform executed the agent, measured execution time, incremented its usage counter, and recorded the run. The response contained:
Gravité : haute
Causes possibles : bottleneck applicatif, fuite mémoire, pic de trafic,
service backend en défaut, erreur applicative ou configuration Nginx.
Actions automatisables : expansion si l'infra le permet, baisse temporaire
du trafic non critique.
Actions avec approbation : revue de code, optimisation Nginx, analyse APM
et logs détaillés.
This isn’t a fully autonomous remediation. For a first-pass alert triage, though, the output is clean, readable, and directly usable in an incident ticket.
What I like about ITOps Agent Platform
The first thing that stands out is the functional breadth. Even running locally with no target SSH server, it’s clear the product isn’t just a chat page. There are sections for servers, workflows, tasks, scripts, alerts, knowledge base, audit, notifications, AI models, and auto-remediation.
I also appreciate that the agents are visible and configurable. The alert agent can be wired to a specific model. The interface shows the primary model, usage count, and status. For operations work, that’s a lot more reassuring than a black box firing everything at a magic endpoint.
Another plus: the product takes OpenAI-compatible models seriously. I was able to connect a local proxy instead of a real external key. For any team that wants to test with OpenRouter, vLLM, LM Studio, or an internal proxy, that’s essential.
Finally, the backend has a proper health endpoint. That might sound basic, but for an ops console it’s critical. You can monitor the monitor.
The limits of ITOps Agent Platform
The most important limit: my test validates the AI analysis and the web console, not a complete repair loop on a real production machine. To validate that level, you’d need to connect a throwaway SSH server, a test Prometheus instance, and a full remediation rule with approval flow.
Second limit: Docker is the recommended install path, but it requires Docker. The source install works, but you need to be comfortable diagnosing Node, SQLite, and native module issues. This isn’t yet a simple tool I’d hand to a small team without a DevOps profile.
Third limit: the npm dependencies deserve an audit. The project potentially handles secrets, SSH keys, server commands, and remediation workflows. In that context, critical alerts in the dependency tree can’t stay as a footnote.
Finally, the interface is rich, almost too rich. For an admin used to Grafana and Ansible, it’ll take time to figure out where the right abstraction lives: agent, workflow, script, remediation policy, execution, or analysis.
Does ITOps Agent Platform actually work?
Yes, for the scope I tested. The product starts from source, initializes its database, exposes its interface, accepts an OpenAI-compatible model, tests the model connection, and executes an agent against a realistic alert.
No, I wouldn’t say the closed automatic repair promise is fully validated by this test. I got usable analysis, not a fix applied to a real server. That’s already useful, but it’s not the same thing as safe and auditable self-healing.
The right positioning today: a lab or pre-production platform for building AI-assisted operations scenarios.
Should you adopt ITOps Agent Platform?
My verdict: try it, but don’t adopt it directly in production.
For a curious DevOps team, it’s a solid playground. You can connect your own models, create specialized agents, and test alert workflows. For a mature SRE team, the project can serve as a prototype to compare a multi-agent approach against Ansible runbooks or Rundeck.
For critical production, I’d ask for: dependency audit, secrets hardening, SSH execution tests on throwaway targets, mandatory approval rules, verified logging, and rollback scenarios.
FAQ
Does ITOps Agent Platform replace Prometheus or Zabbix?
No. It sits after them, as an analysis, orchestration, and remediation layer. Prometheus or Zabbix remain the alert sources.
Can you use ITOps Agent Platform without an official OpenAI key?
Yes, as long as you have an OpenAI-compatible endpoint. In my test, a local compatible proxy was enough to create a model, test the connection, and run an agent.
Is ITOps Agent Platform production-ready?
Not as-is, based on my test. It deserves a serious lab trial, followed by a security audit and controlled remediation scenarios before it touches any sensitive servers.